MechanicalNov 2025
Compressor Polytropic Process Analysis
Sole Analyst — MMAN2700 Individual Assignment
A thermodynamics lab analysis of a reciprocating piston compressor run across five delivery pressures. The textbook extremes are isothermal (n = 1) and isentropic (n = 1.4). Real machines sit between the two. The task was to find where this one lands and quantify how far the ideal models deviate from measured behaviour.
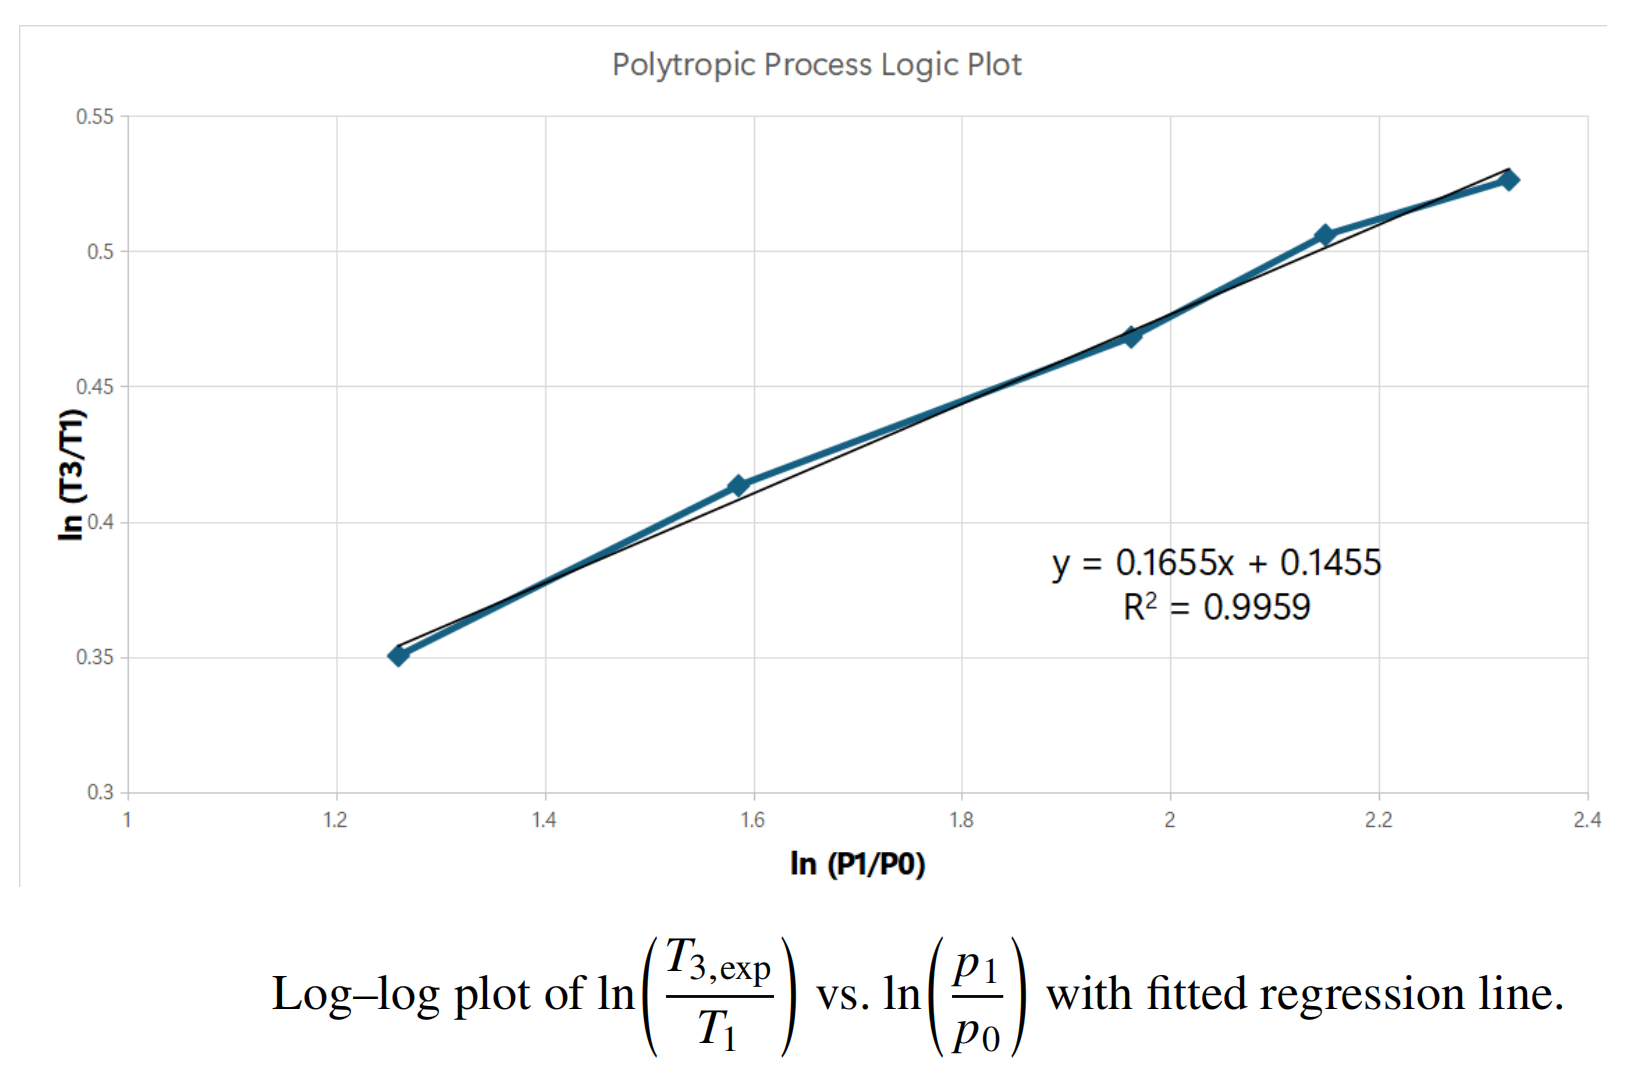
- Plotted ln(T3/T1) against ln(p1/p0) across five delivery pressures and fitted regression; the slope gives polytropic index directly and came out at 1.198
- Isentropic model overpredicted outlet temperature by 20% at maximum delivery pressure; an engineer sizing intercoolers from the ideal model would be working from inflated numbers
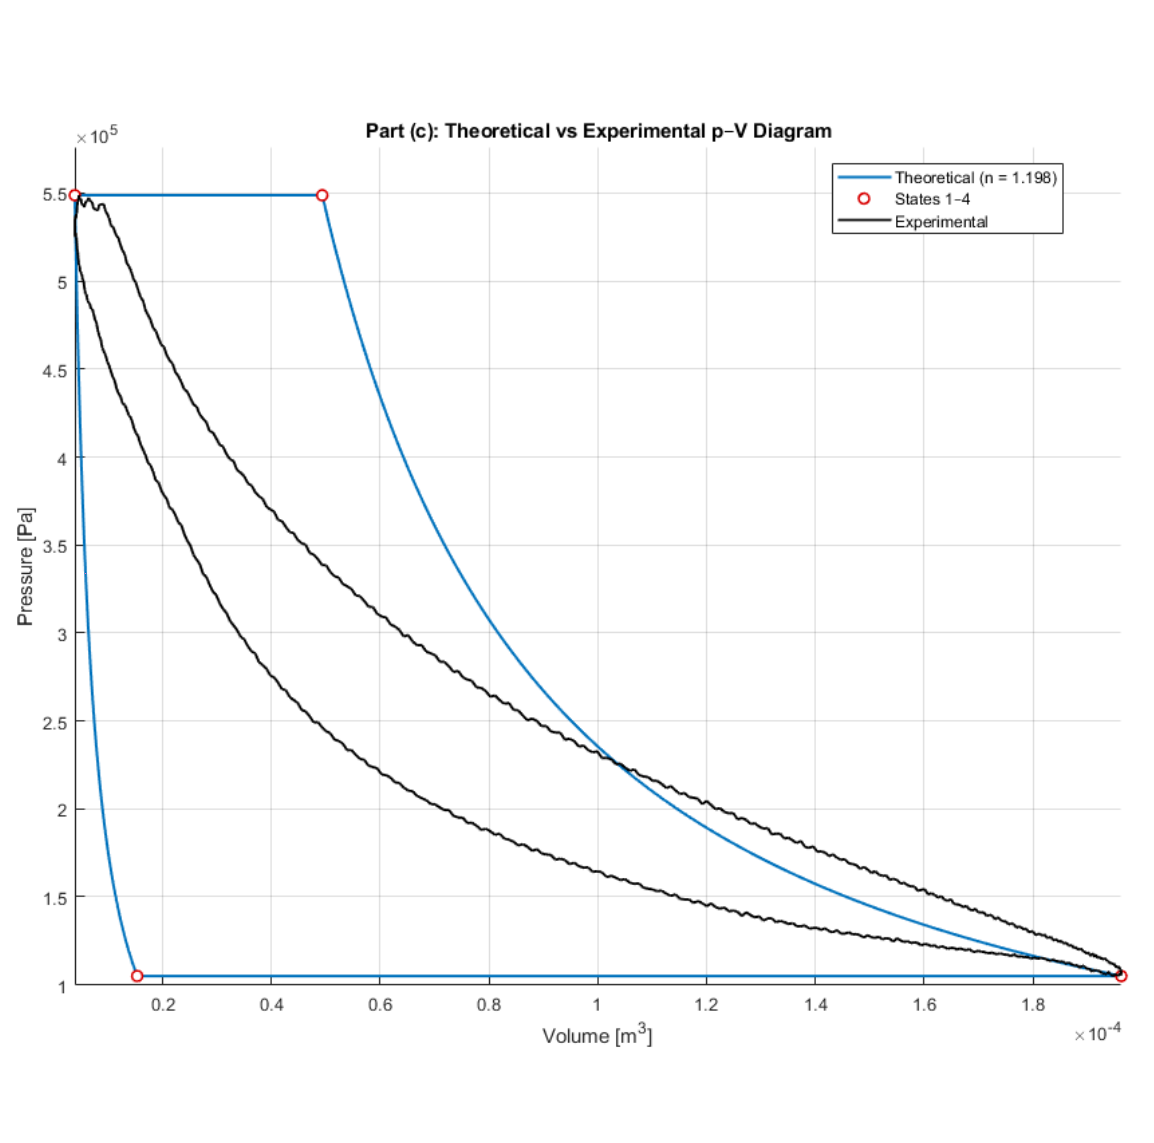
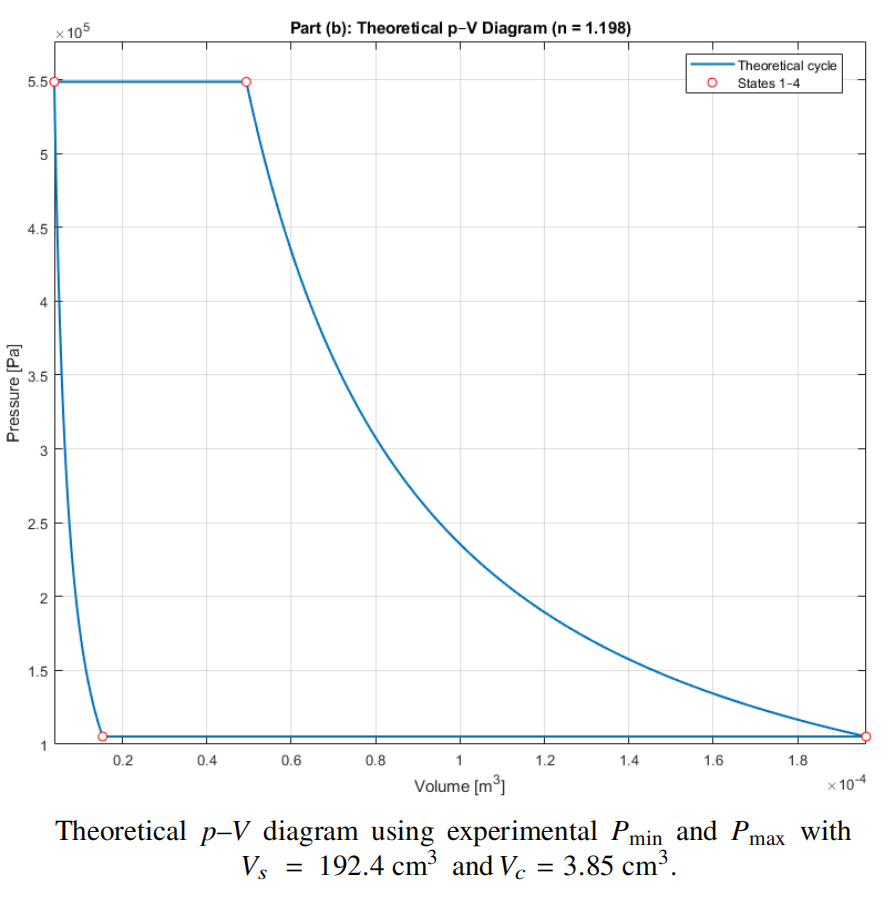
- Built P-V diagram from scratch using slider-crank kinematic relations on crank-angle data to get piston position at each measurement point
- Experimental indicated work 11.59 J against theoretical 36.42 J; the 68% gap is attributed to valve delays, blow-by, heat transfer, and friction
Tech Stack
Polytropic Process AnalysisSlider-Crank KinematicsMATLABP-V Diagram ConstructionRegression Analysis
Gallery


Challenges
- Converting crank-angle data to piston displacement using slider-crank kinematic relations
- Separating heat transfer, valve losses, and leakage as contributors to the polytropic index
- Explaining why isentropic error grows with delivery pressure rather than staying constant
Outcomes
- Polytropic index of 1.198 fitted from experimental data across five delivery pressures
- Isentropic model error quantified from near zero at low pressure to 20% at maximum delivery pressure
- P-V diagram constructed from first principles; experimental indicated work of 11.59 J compared against theoretical 36.42 J